Correlation: The Foundation of ML
- What correlation is and how to read its value
- Why correlation is the simplest signal a model can use
- The most famous warning sign in statistics: correlation ≠ causation
The big idea
Every machine-learning model — no matter how fancy — is, deep down, looking for the same thing: relationships between variables. When the input goes up, does the output go up too? Down? Or is there no pattern at all?
The simplest measure of "do these two things move together?" is the correlation coefficient, a number between –1 and +1.
The three flavors of correlation
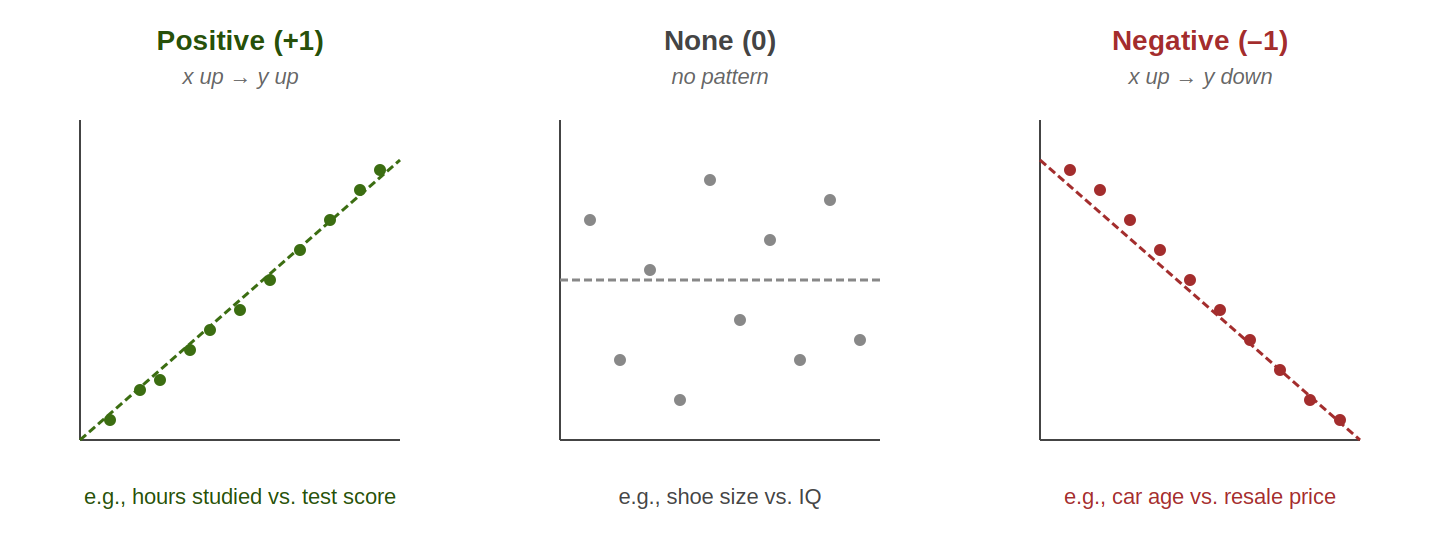
| Correlation value | Meaning |
|---|---|
+1.0 |
Perfect positive — every point on the line; x↑ implies y↑ |
+0.7 to +0.9 |
Strong positive — generally moves together with some scatter |
±0.3 to ±0.5 |
Moderate — relationship exists but lots of noise |
~0 |
No linear relationship — could still be a non-linear one! |
-0.7 to -0.9 |
Strong negative — one goes up, the other down |
-1.0 |
Perfect negative — every point on a downward line |
Try it: Interactive correlation explorer
Visit rpsychologist.com/correlation and drag the slider. Watch how the scatter changes as the correlation value moves from –1 through 0 to +1. Spend at least 3 minutes — getting a "feel" for what a 0.3 correlation looks like compared to a 0.8 will pay off all semester.
Correlation in code
import pandas as pd

# Load a sample dataset
df = pd.read_csv("https://gist.githubusercontent.com/seankross/a412dfbd88b3db70b74b/raw/5f23f993cd87c283ce766e7ac6b329ee7cc2e1d1/mtcars.csv")  # mtcars.csv -- car characteristics dataset

# Compute correlation between all pairs of numeric columns
correlations = df.corr(numeric_only=True)
print(correlations["mpg"].sort_values())

# Or visualize as a heatmap
import seaborn as sns
import matplotlib.pyplot as plt
sns.heatmap(df.corr(numeric_only=True), annot=True, cmap="RdBu_r", center=0)
plt.show()
You'll generate exactly this kind of heatmap in Module 3.
The famous warning: correlation ≠ causation
- Ice-cream sales and shark attacks both rise in summer. Eating ice cream doesn't summon sharks — warm weather causes both.
- Cities with more firefighters have more fires. Hiring firefighters doesn't cause fires — bigger cities cause both.
- People who own more umbrellas earn more money. Buying umbrellas won't make you rich — living in a rainy, often urban area causes both.
ML models exploit correlation without caring about causation. This is fine for prediction ("will this customer cancel?") but dangerous for decision-making ("should we charge umbrella-owners more for car insurance?"). We'll revisit this in Module 10 on ethics.
Where this is going
In Module 4, you'll see linear regression — which is essentially "find the line of best fit through correlated points." In Module 5, classification algorithms find more complex versions of "things that vary together." In Module 7, feature engineering is mostly about creating new variables that correlate better with your target. Correlation is the engine room of the whole course.
Check your understanding
- If two variables have a correlation of 0, can there still be a relationship between them?
- Which is stronger: a correlation of -0.85 or +0.6?
- A study finds children who eat breakfast score higher on tests, with correlation r = 0.4. Does eating breakfast cause better test scores? What about if r = 0.9?
Show answers
- Yes -- correlation only measures linear relationships. A U-shape (e.g., performance vs. caffeine intake) can have r near 0 but a very real non-linear pattern.
- -0.85 is stronger -- strength is the absolute value. The sign just tells direction.
- Not necessarily. Households where kids eat breakfast may also have more stable schedules, more involved parents, more resources. Any of those could be the real cause. | For r = 0.9, there is a strong positive correlation, but no way to know if there's a causal link.